PROJECT 01
Australian Emergency Department Performance Analytics
An end-to-end analytics project exploring emergency department demand and service performance across Australian public hospitals.
OVERVIEW
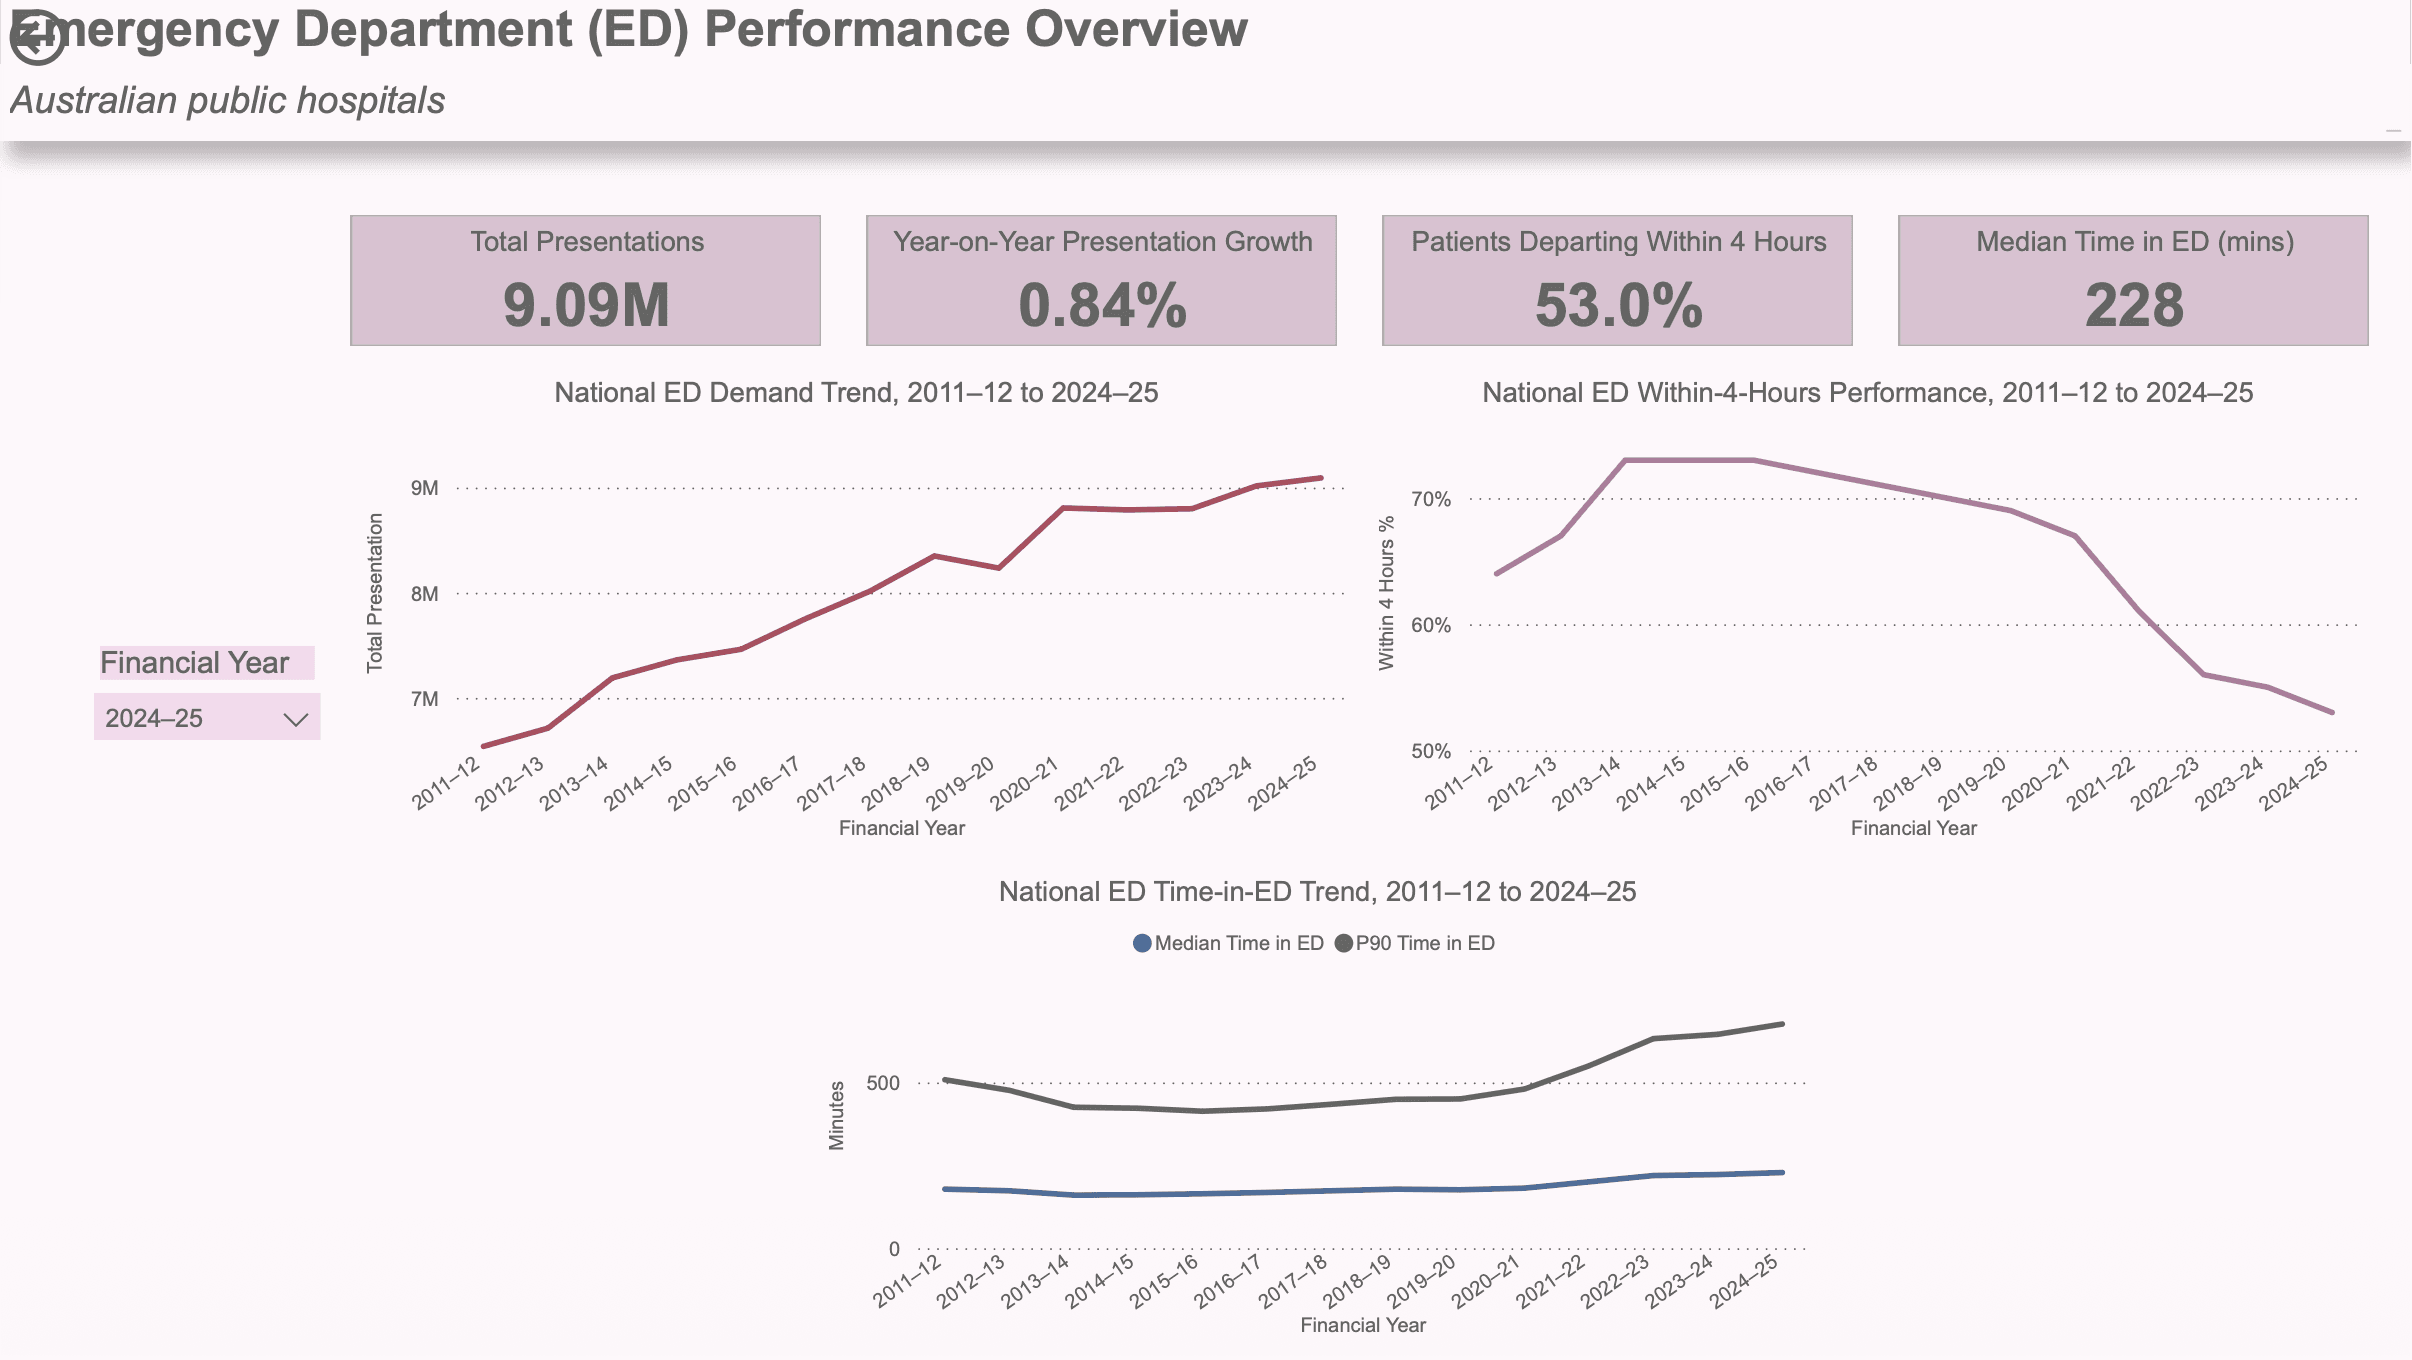
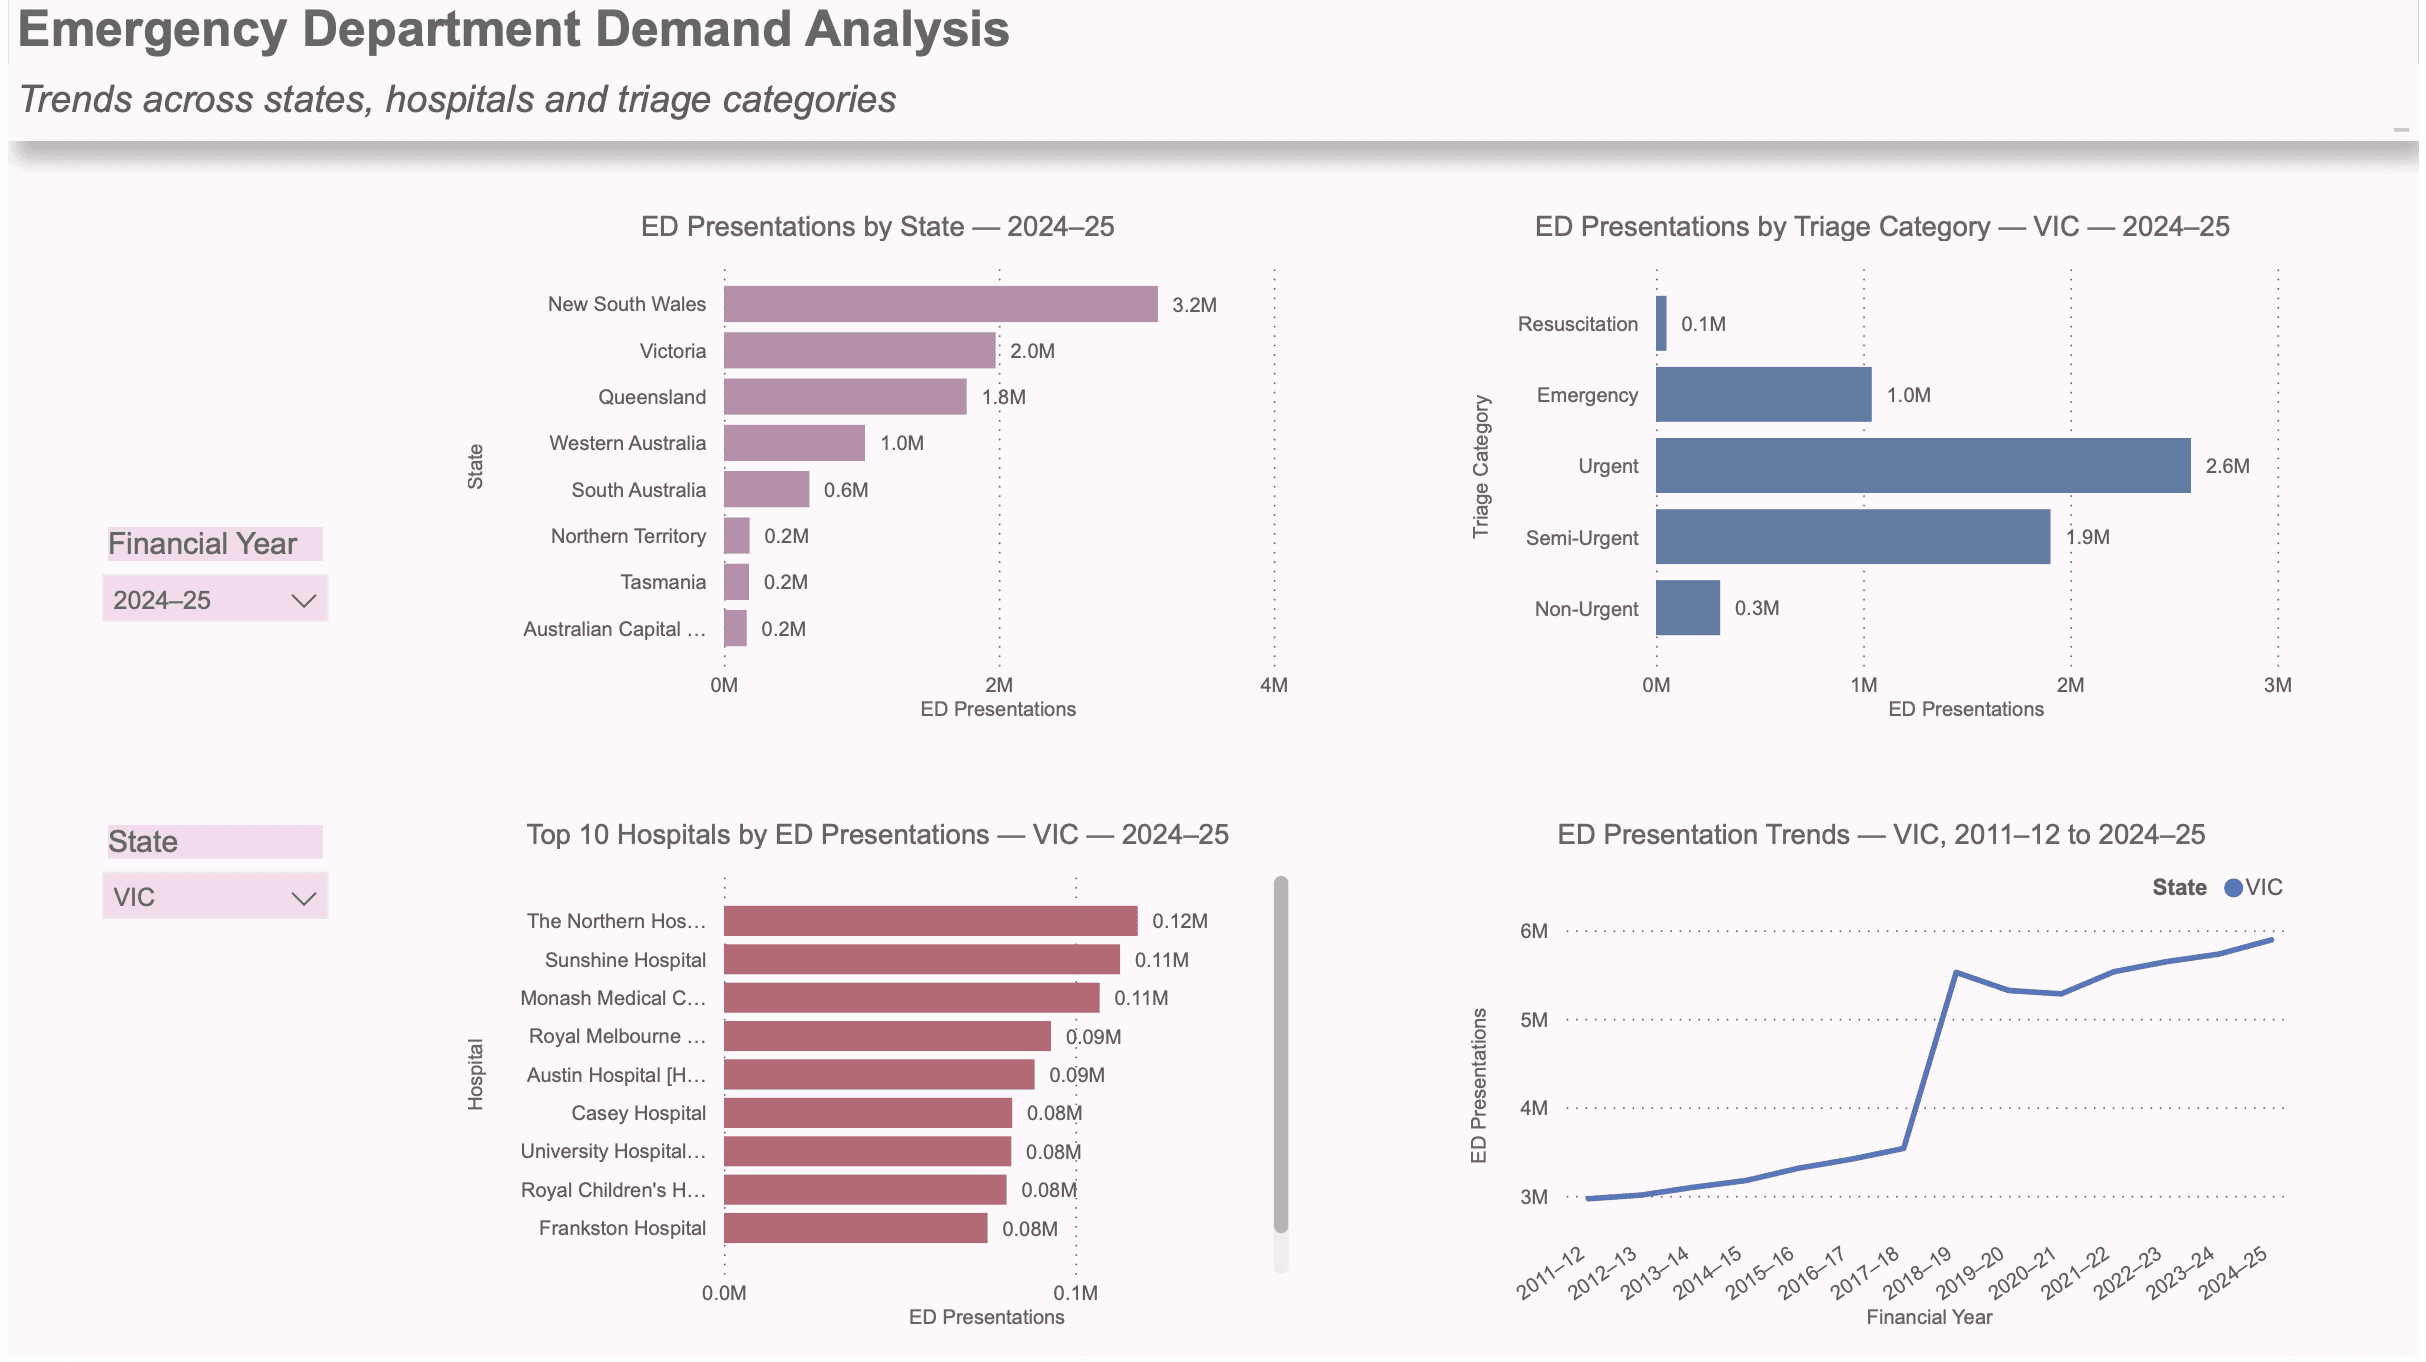
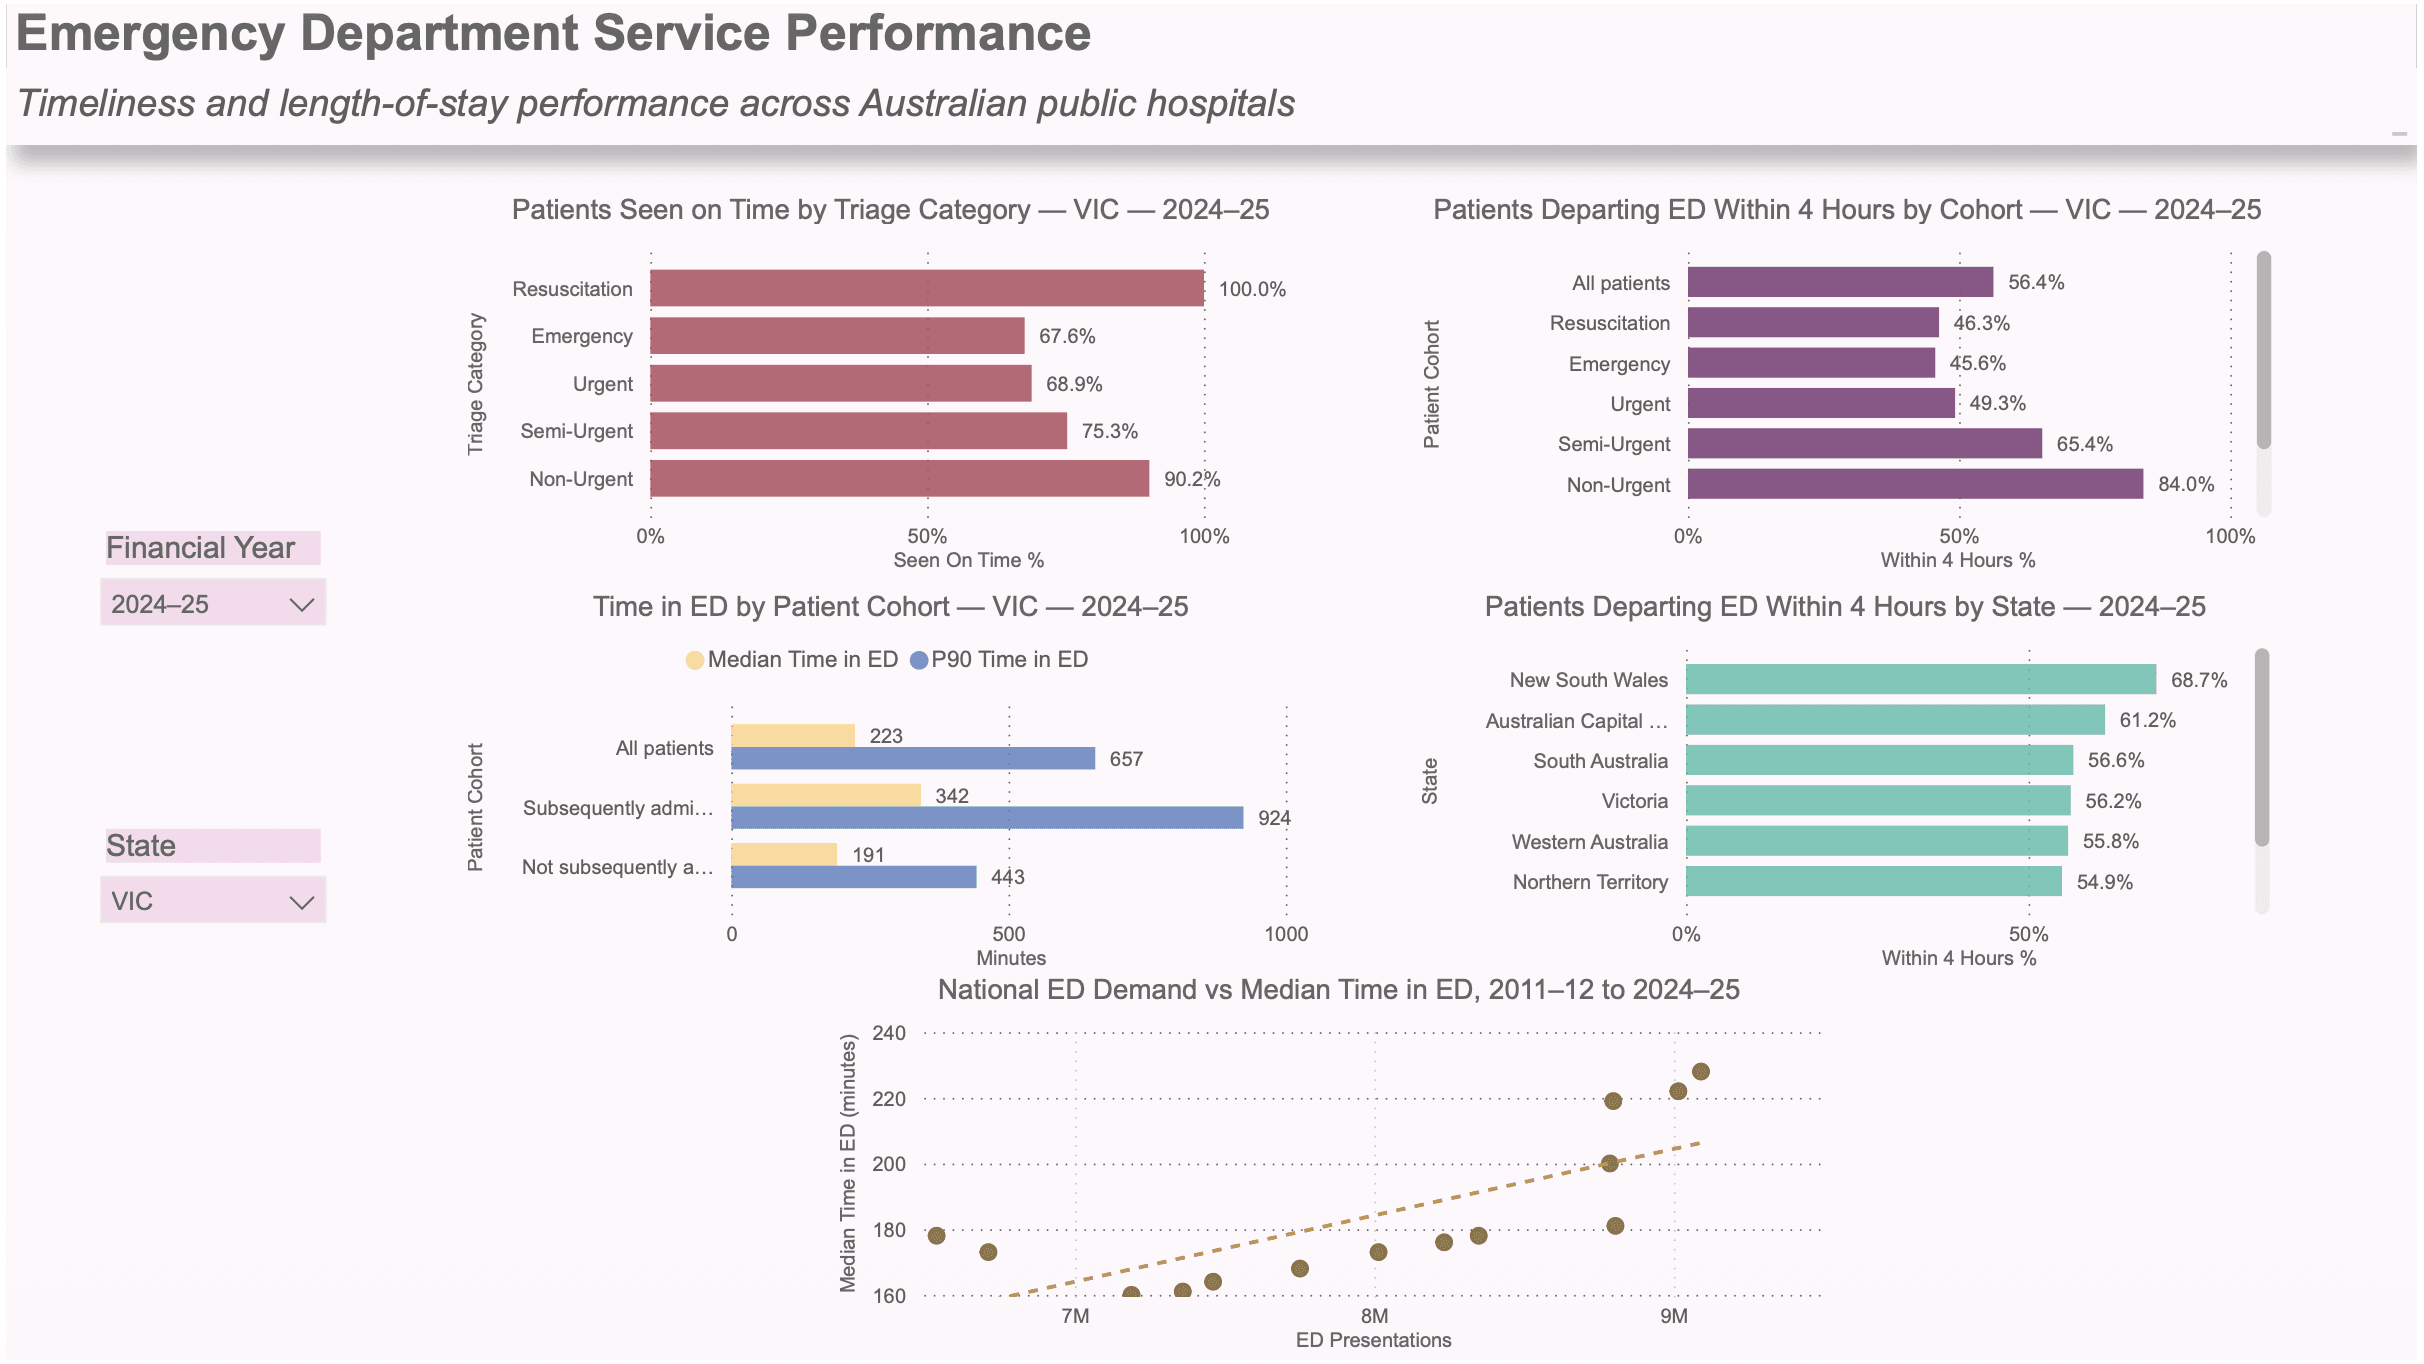
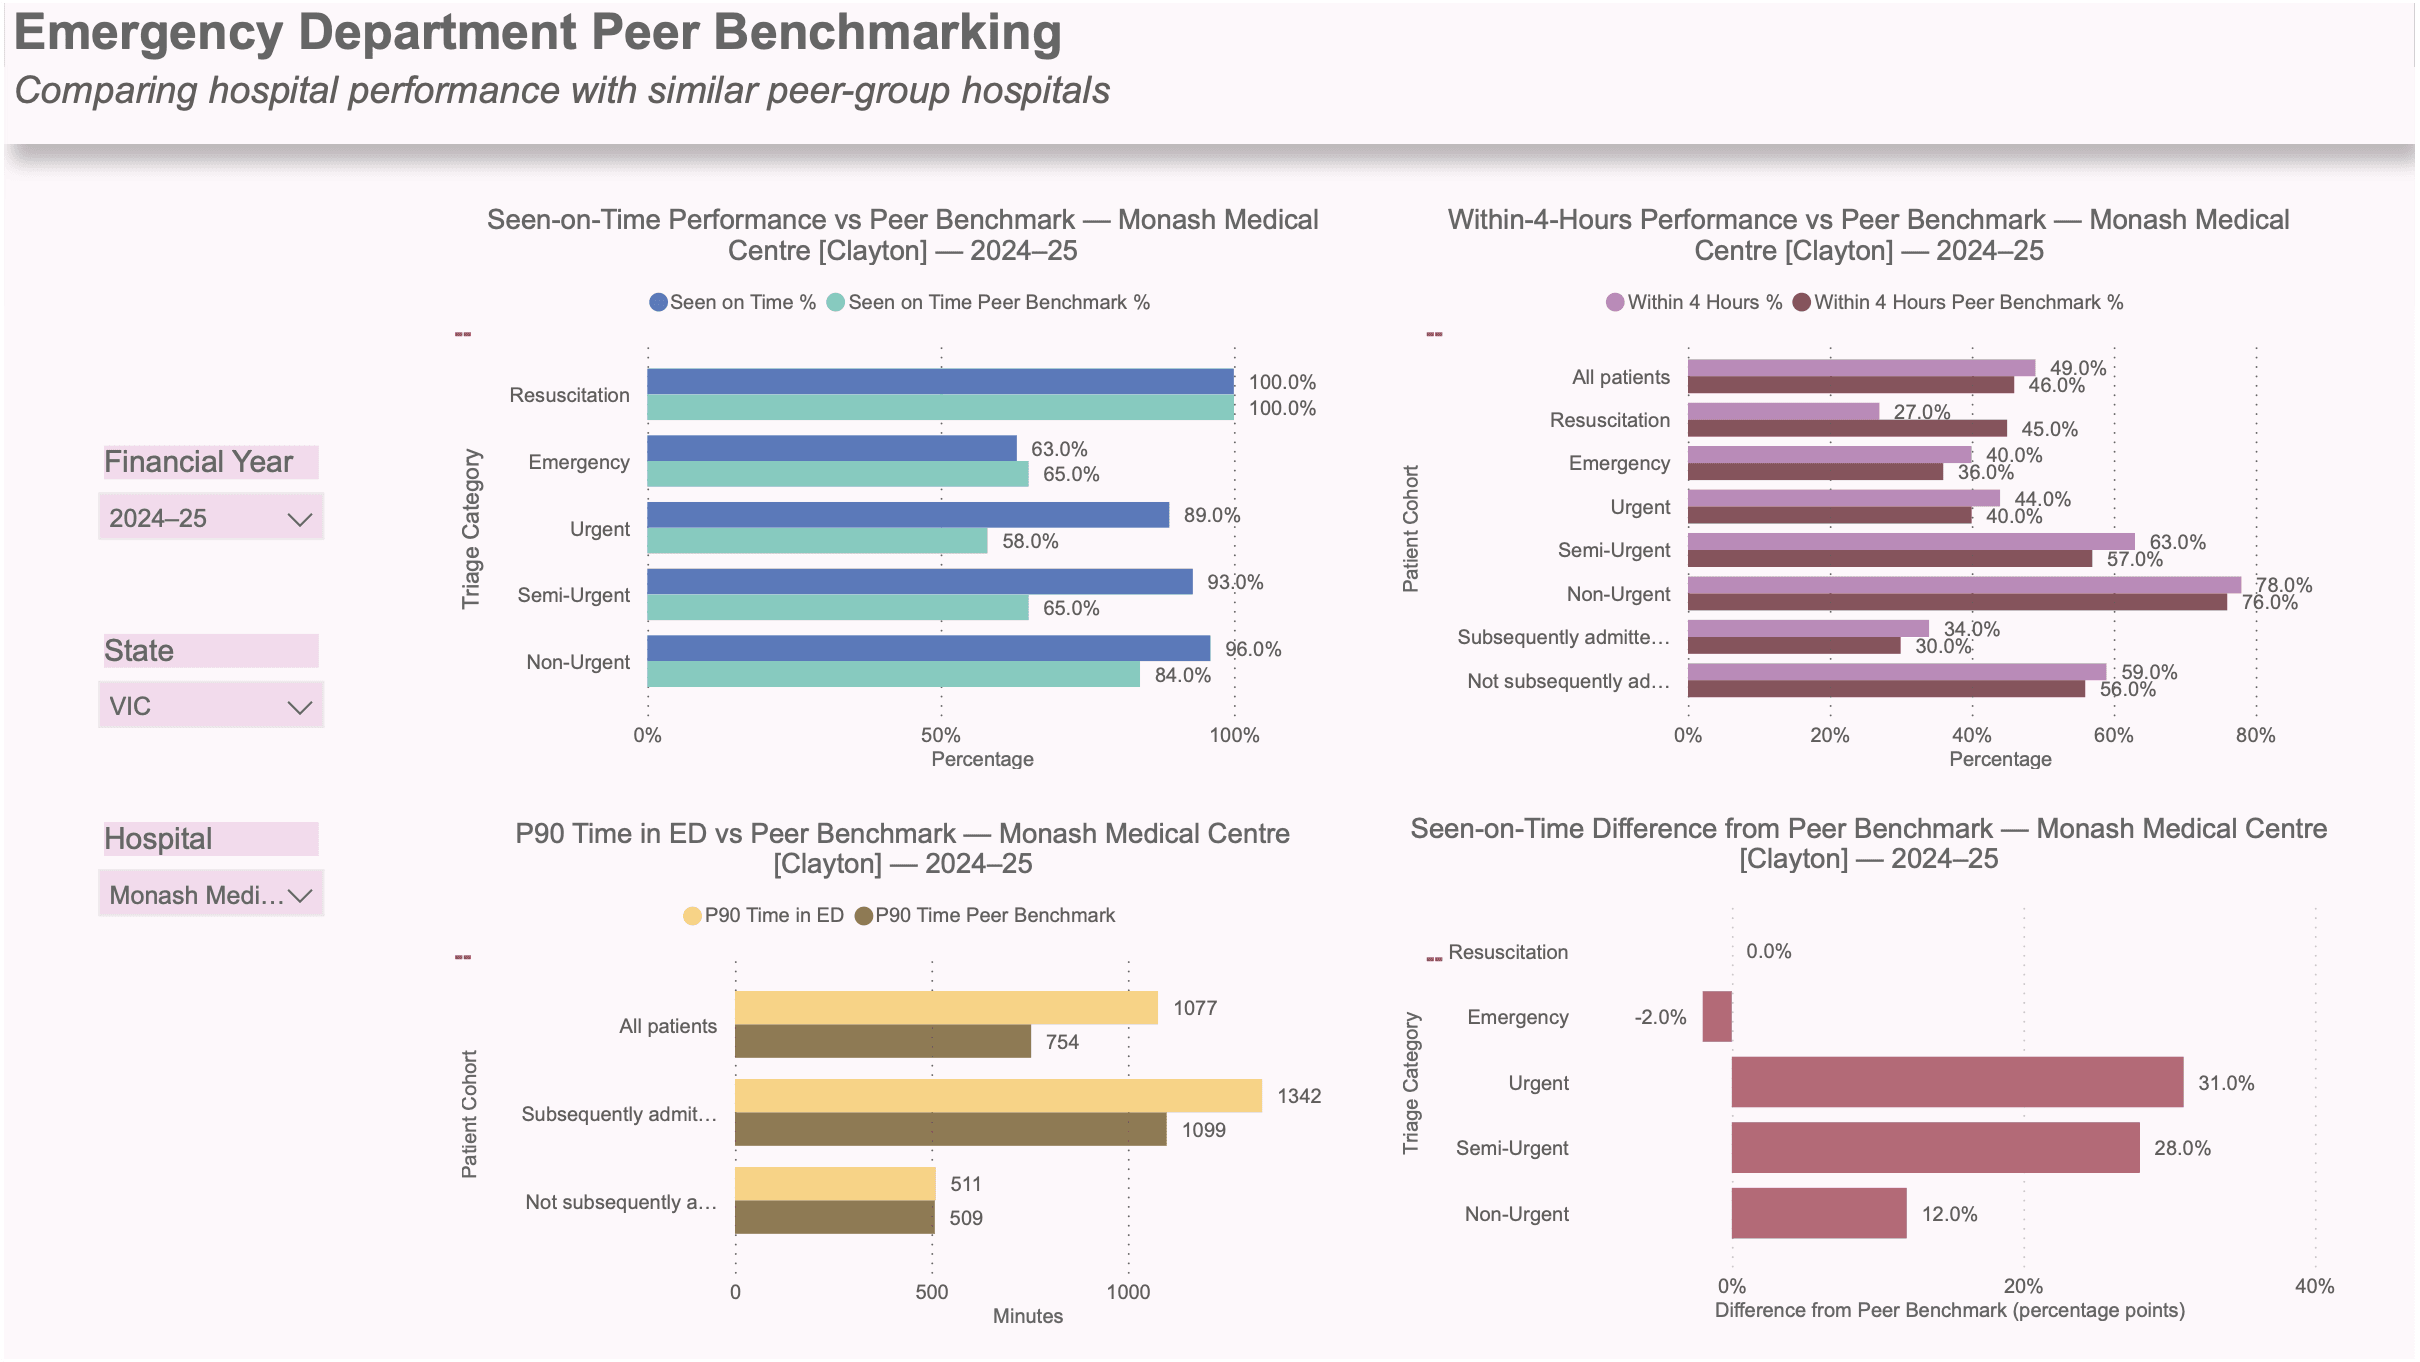
This project explores emergency department demand and service performance across Australian public hospitals using publicly available AIHW data. The goal was to build an end-to-end analytics workflow that transforms complex healthcare data into clear, decision-focused insights.
THE PROBLEM
Emergency department performance data is spread across multiple indicators, reporting levels and time periods, making it difficult to quickly understand how demand and service performance are changing. I wanted to create a consistent analytical model that could support comparisons across states, hospitals and peer groups.
APPROACH
I cleaned and transformed the source data in Python, designed a relational data model, loaded the processed data into PostgreSQL, and used SQL for validation and analysis. The final dataset was connected to Power BI to create an interactive dashboard covering demand trends, service performance and peer benchmarking.
KEY FINDINGS
The analysis highlighted long-term growth in emergency department presentations alongside declining within-four-hours performance. It also revealed meaningful variation across states, hospitals, triage categories and peer groups.